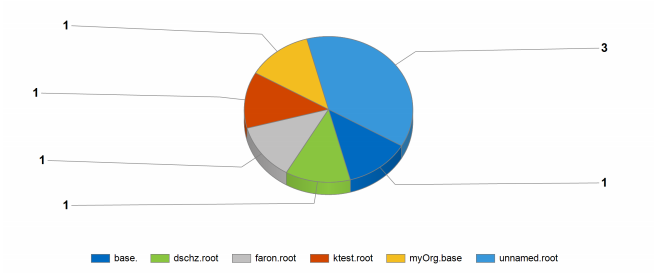
Problem: When using the Kaseya Reporting Services engine, charts don't display correctly, no 3D / values, etc. I.e.:

Cause: This is happens with the Kaseya Reporting Services engine, but not with SSRS. You can confirm which reporting engine is in use via "System module > Configure page":

Workaround: Switch to SSRS to get charts to show in 3D and display values, etc. Example:

Note: You can follow this guide to get SSRS configured; if you run into any issues after configuring this where reports don't load / error out, please contact Kaseya Support