QUESTION
How to investigate a failure of the CSE (Correlation and Summary Engine) and DGE (Data Gathering Engine) components?
RESOLUTION
This troubleshooting article is focused more towards the DGE (Data Gathering Engine) and the CSE (Correlation & Summary Engine) components, but in general can be be applied to the other components as well. These steps are meant to be taken as a guideline of troubleshooting a component that frequently fails (shows as critical on the SUPERUSER > HEALTH page). If possible, to gather as much as data possible, do not restart the component until after you are able to at least generate a heap memory dump or a thread dump. These two processes are only useful while the component is in this failed state (assuming the process is still running).
Traverse Logs
Being aware of when the component had failed or went critical is crucial in this step as evidence of the cause of the failure may be logged immediately before or at the time of failure. Reviewing information within the log up to 2 minutes before the actual failure may give an indication of what activity eventually led to the component failing. In general, reviewing the error log (error-yyyy-mm-dd-.log) is the best place to start.
If nothing obvious, the next step would be to review in the same way the component specific logs:
CSE
The relevant log(s) would be summary.log. By default, Traverse keeps a roll over rotation up to two additional indexes (i.e. summary.log.1 and summary.log.2).
DGE
The relevant log(s) would be monitor.log. By default, Traverse keeps a roll over rotation up to four additional indexes (i.e. monitor.log.1, monitor.log.2, monitor.log.3, and monitor.log.4).
Heap memory dump
This step assumes the component is in the failed state, but still listed as running within the Traverse Service Controller (or ./etc/traverse.init status for Linux).
Gathering the heap memory dump will allow the engineering team to investigate what the component is/was doing before it failed within the heap memory. It may also prove useful to gather "snapshots" of the components over time to analyze what was going on in a working state over time that may lead up to a failure. An example of this would be to generate a heap memory dump 10 minutes following a component restart then generating one every day (or on the hour depending how quickly the component fails).
Please refer to https://kaseya.zendesk.com/entries/79684013 for instructions.
JMX Port Numbers for Traverse Components:
Web Application - 7691
Data Gathering Engine - 7692
Message Handler - 7693
Correlation and Summary Engine - 7696
Thread dump
This step assumes the component is in the failed state, but still listed as running within the Traverse Service Controller (or ./etc/traverse.init status for Linux)
Gathering the thread dump will allow the engineering team to investigate what related processes or threads were running when the component reached a failed state. It may also prove useful to gather "snapshots" of the components over time to analyze what processes are running (or still running) that may eventually lead to a failure. An example of this would be to generate a thread dump 10 minutes following a component restart then generating one every day (or on the hour depending how quickly the component fails).
Please refer to https://helpdesk.kaseya.com/entries/96704546 for instructions.
JMX Port Numbers for Traverse Components:
Web Application - 7691
Data Gathering Engine - 7692
Message Handler - 7693
Correlation and Summary Engine - 7696
Windows Event Viewer

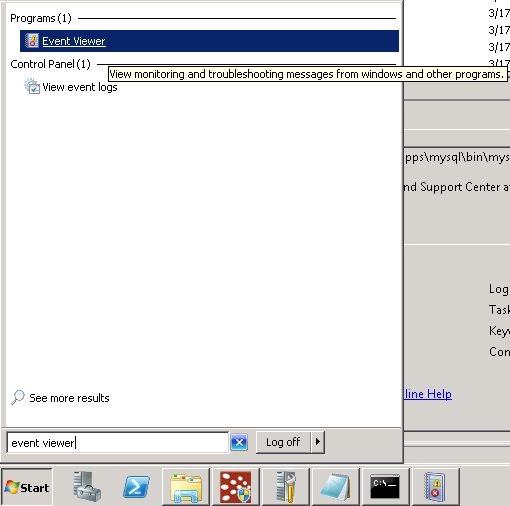
Open the 'Event Viewer' by clicking on the Windows Start button and running/searching 'Event Viewer'

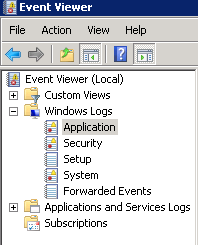
Expand the 'Windows Logs' and review the events/logs within 'Application' and 'System'

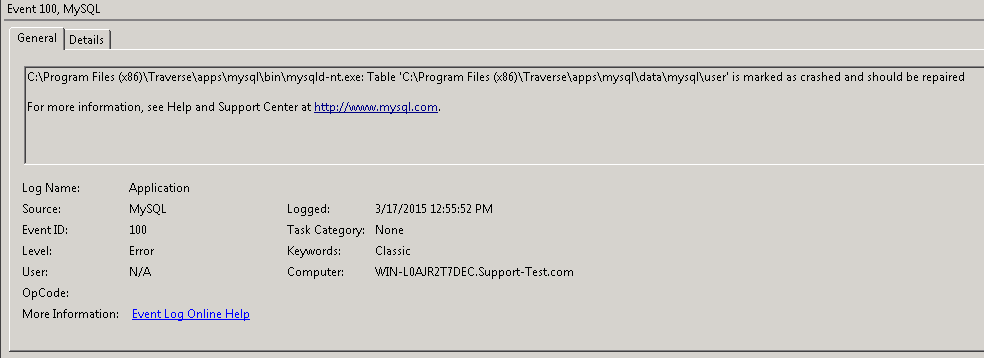
With the same guidelines as reviewing the Traverse logs, examining an Error or an event at (or around) the time of the failure can give additional insight. The General tab should give you a summary of the event or Error and the Details tab may provide additional information.
WMI/SNMP component native memory test
WMI:
https://kaseya.zendesk.com/entries/81220746
SNMP:
https://kaseya.zendesk.com/entries/90818537
WMI/SNMP component heap memory test (in progress)
APPLIES TO
All versions of Traverse
REFERENCE
None.