Problem
When trying to view collected data in table or graph formats the information displayed does not cover the period specified.
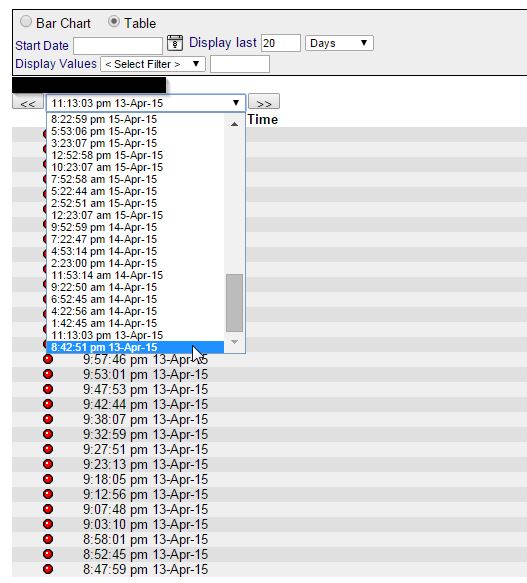
In the picture below the the current date is 21/04/2015 so the specified range should return results prior to the 13th but it does not.
Cause
By design these tables and graphs can only return 2000 rows of data from the base tables. If this 2000 record count is reached prior to the date range criteria then only this more limited data will be shown.
Resolution
To display the desired date range would be to reduce the frequency the counter is sampled. This would then reduces the number of records per day allowing more days to be displayed before the 2000 limit is reached.
Please note that changing the sample interval will not change the pre-existing records per-day but help to reduce the problem going forward.